
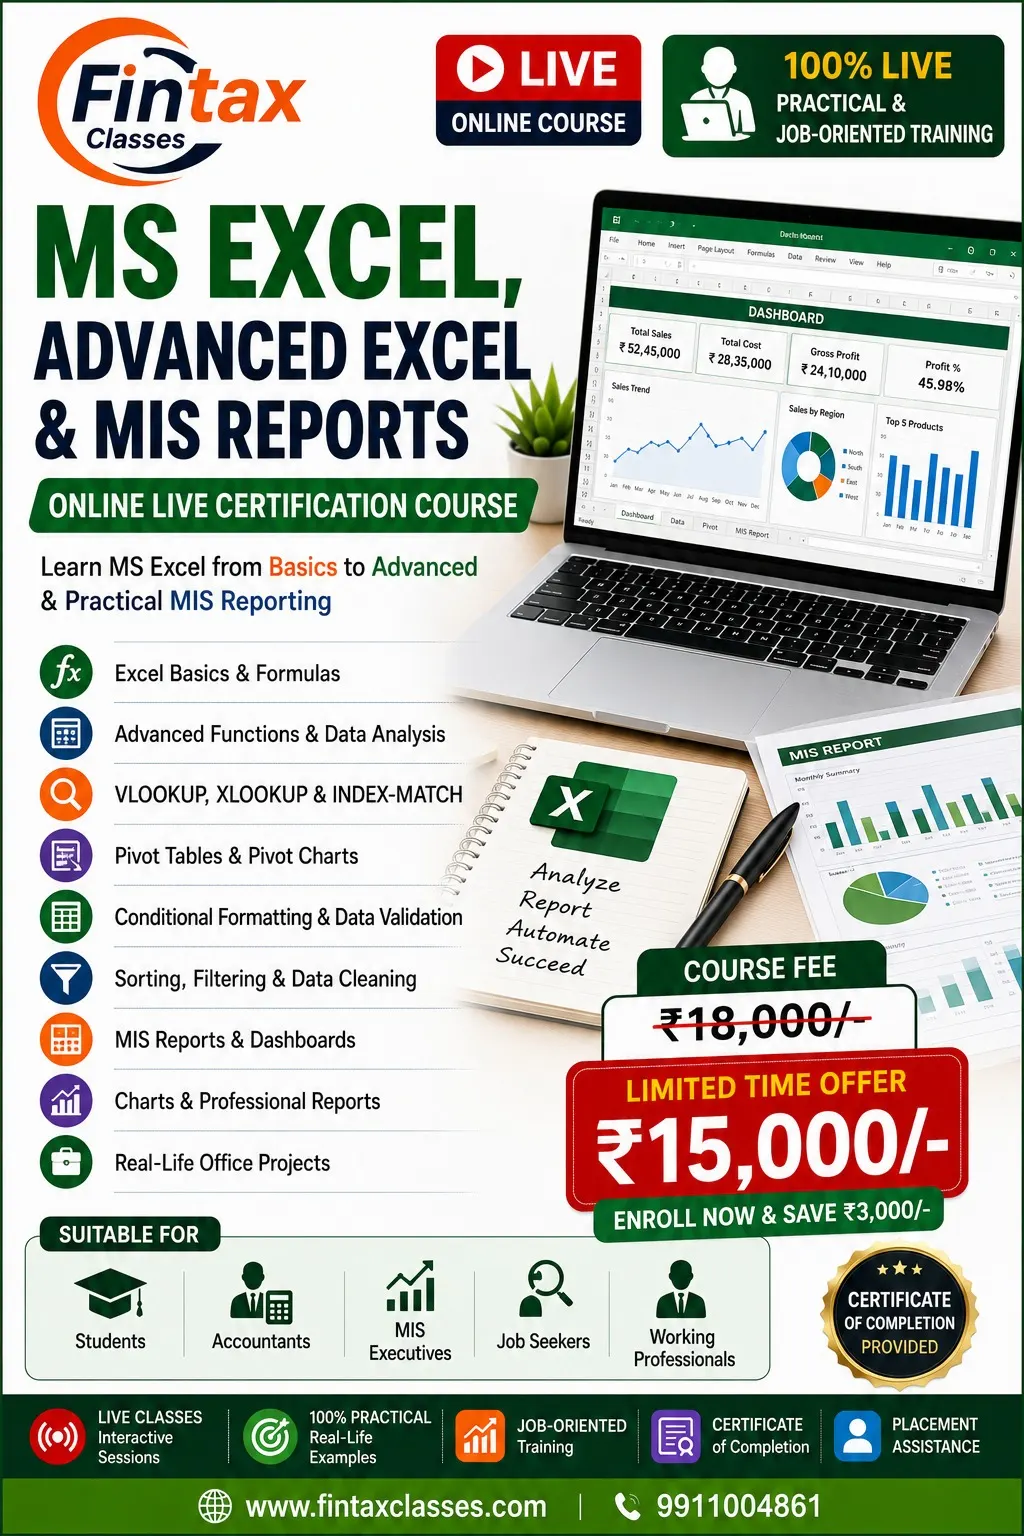
MS Excel, Advanced Excel & MIS Reporting – Online Live Certification Course
Learn MS Excel from Basics to Advanced & Practical MIS Reporting through 100% Live, Practical & Job-Oriented Training.
This comprehensive course is designed for students, accountants, MIS executives, job seekers and working professionals who want to develop practical Excel skills for day-to-day office work, accounting, reporting, data analysis and MIS management.
The course covers Excel fundamentals, formulas, advanced functions, data cleaning, lookup functions, Pivot Tables, Pivot Charts, dashboards, charts, professional reporting and real-life office projects.
What You Will Learn
1. MS Excel Basics
Build a strong foundation in Microsoft Excel.
- Understanding Excel interface
- Workbook and worksheet management
- Rows, columns and cells
- Data entry and editing
- Cell formatting
- Number, date and text formatting
- Basic worksheet operations
- Copy, paste and fill options
- Basic printing and page setup
- Practical Excel exercises
2. Excel Formulas & Functions
Learn essential formulas used in everyday office work.
- Basic mathematical formulas
- SUM
- AVERAGE
- COUNT and COUNTA
- MIN and MAX
- IF function
- AND and OR
- ROUND and related functions
- Percentage calculations
- Date calculations
- Text functions
- Formula error handling
- Practical formula exercises
3. Advanced Excel Functions
Learn advanced functions for data analysis and reporting.
- VLOOKUP
- XLOOKUP
- HLOOKUP basics
- INDEX
- MATCH
- INDEX-MATCH combination
- IFERROR
- SUMIF
- SUMIFS
- COUNTIF
- COUNTIFS
- AVERAGEIF
- AVERAGEIFS
- Text and date functions
- Combining multiple functions
- Practical advanced formula cases
4. VLOOKUP, XLOOKUP & INDEX-MATCH
Develop practical skills in searching and matching data.
- Understanding lookup functions
- VLOOKUP syntax and usage
- Approximate and exact matching
- XLOOKUP fundamentals
- INDEX and MATCH
- INDEX-MATCH combination
- Lookup across tables
- Handling missing data
- Error handling
- Real-world lookup examples
5. Data Sorting & Filtering
Learn how to organize and analyze large datasets.
- Sorting data
- Multi-level sorting
- Filtering data
- Advanced filtering concepts
- Custom filters
- Number and date filters
- Text filters
- Removing unwanted records
- Working with large datasets
- Practical data management
6. Data Cleaning
Learn how to prepare raw data for reporting and analysis.
- Identifying duplicate records
- Removing duplicates
- Handling blank cells
- Text-to-Columns
- Find and Replace
- TRIM and text cleaning
- Data formatting
- Standardizing data
- Cleaning inconsistent records
- Practical data cleaning cases
7. Conditional Formatting
Learn how to highlight important information automatically.
- Basic conditional formatting
- Highlighting values
- Duplicate value identification
- Data bars
- Color scales
- Icon sets
- Formula-based conditional formatting
- Performance-based highlighting
- Practical reporting examples
8. Data Validation
Learn how to control and standardize data entry.
- Understanding data validation
- Drop-down lists
- Number restrictions
- Date restrictions
- Text length restrictions
- Input messages
- Error alerts
- Creating professional data entry sheets
- Practical data validation examples
9. Pivot Tables
Learn one of Excel’s most powerful data analysis tools.
- Introduction to Pivot Tables
- Creating Pivot Tables
- Rows, columns and values
- Filters and slicers
- Grouping data
- Date-based analysis
- Summarizing large datasets
- Calculated fields basics
- Refreshing Pivot Tables
- Practical Pivot Table projects
10. Pivot Charts
Learn how to convert Pivot Table data into meaningful visual reports.
- Creating Pivot Charts
- Selecting appropriate charts
- Chart filtering
- Using slicers
- Dynamic reporting concepts
- Comparing business data
- Creating management-friendly reports
- Practical Pivot Chart examples
11. Charts & Data Visualization
Learn how to present data professionally.
- Column charts
- Bar charts
- Line charts
- Pie charts
- Area charts
- Combination charts
- Chart formatting
- Data labels
- Titles and legends
- Professional chart design
- Choosing the right chart for data
12. MIS Reporting
Learn how Excel is used for practical MIS reporting.
- Understanding MIS
- MIS report structure
- Daily MIS
- Weekly MIS
- Monthly MIS
- Sales MIS
- Purchase MIS
- Expense MIS
- Employee MIS
- Attendance MIS
- Performance MIS
- Management reporting
13. MIS Dashboards
Learn how to create interactive and professional Excel dashboards.
- Dashboard fundamentals
- Dashboard layout
- KPI creation
- Summary tables
- Charts and visualizations
- Pivot-based dashboards
- Slicers
- Filters
- Dynamic reporting concepts
- Management dashboard
- Practical dashboard project
14. Professional Excel Reports
Learn how to convert raw data into professional business reports.
- Report formatting
- Professional tables
- Headers and footers
- Page layout
- Print settings
- Report presentation
- Data summaries
- Management-friendly reporting
- Monthly report preparation
- Practical reporting cases
Real-Life Office Projects
The course includes practical projects based on common office requirements.
Examples include:
- Sales MIS Report
- Purchase MIS Report
- Employee MIS
- Attendance Report
- Expense Report
- Customer Data Analysis
- Product-wise Sales Analysis
- Monthly Performance Report
- Dashboard Creation
- Management Summary Report
Complete Excel Reporting Workflow
During the course, you will understand the complete process:
Raw Data → Data Cleaning → Formulas → Data Analysis → Pivot Tables → Charts → MIS Report → Dashboard → Management Reporting
This workflow helps you understand how Excel is actually used in professional office environments.
Practical Training Approach
This is a 100% Live, Practical & Job-Oriented Excel Training Course.
The training focuses on:
- Live practical demonstrations
- Step-by-step Excel exercises
- Real-world datasets
- Formula practice
- Data analysis
- MIS report preparation
- Dashboard creation
- Office-based projects
- Practical problem-solving
Who Should Join This Course?
This course is suitable for:
- Students
- B.Com Students
- M.Com Students
- Accountants
- MIS Executives
- HR Professionals
- Finance Professionals
- Freshers
- Job Seekers
- Working Professionals
- Business Owners
- Anyone who wants to improve Excel skills
Why Choose This Course?
- 100% Live Training
- Practical & Job-Oriented Learning
- Beginner to Advanced Excel
- Advanced Excel Functions
- VLOOKUP & XLOOKUP
- INDEX-MATCH
- Pivot Tables & Pivot Charts
- Data Cleaning
- Conditional Formatting
- Data Validation
- MIS Reports
- Excel Dashboards
- Professional Charts
- Real-Life Office Projects
Skills You Can Develop
After completing this course, you can develop practical skills in:
- MS Excel
- Advanced Excel
- Excel Formulas
- Data Analysis
- VLOOKUP
- XLOOKUP
- INDEX-MATCH
- Pivot Tables
- Pivot Charts
- Data Cleaning
- Data Validation
- Conditional Formatting
- MIS Reporting
- Excel Dashboards
- Business Reporting
- Data Visualization
Course Outcome
After completing this course, you will have practical knowledge of using Excel for everyday office work, accounting, data analysis and management reporting.
You will be able to work with formulas and advanced functions, clean and organize datasets, perform lookups, create Pivot Tables and Charts, prepare MIS reports, build dashboards and present business data in a professional format.
The course is designed to help you build practical, job-ready Excel and MIS reporting skills for accounting, finance, HR, administration, MIS and other office roles.
Start Your Excel Learning Journey
Build confidence in MS Excel, Advanced Excel, Data Analysis, MIS Reporting and Dashboard Creation through live practical training and real-life office projects.

Reviews
There are no reviews yet.